
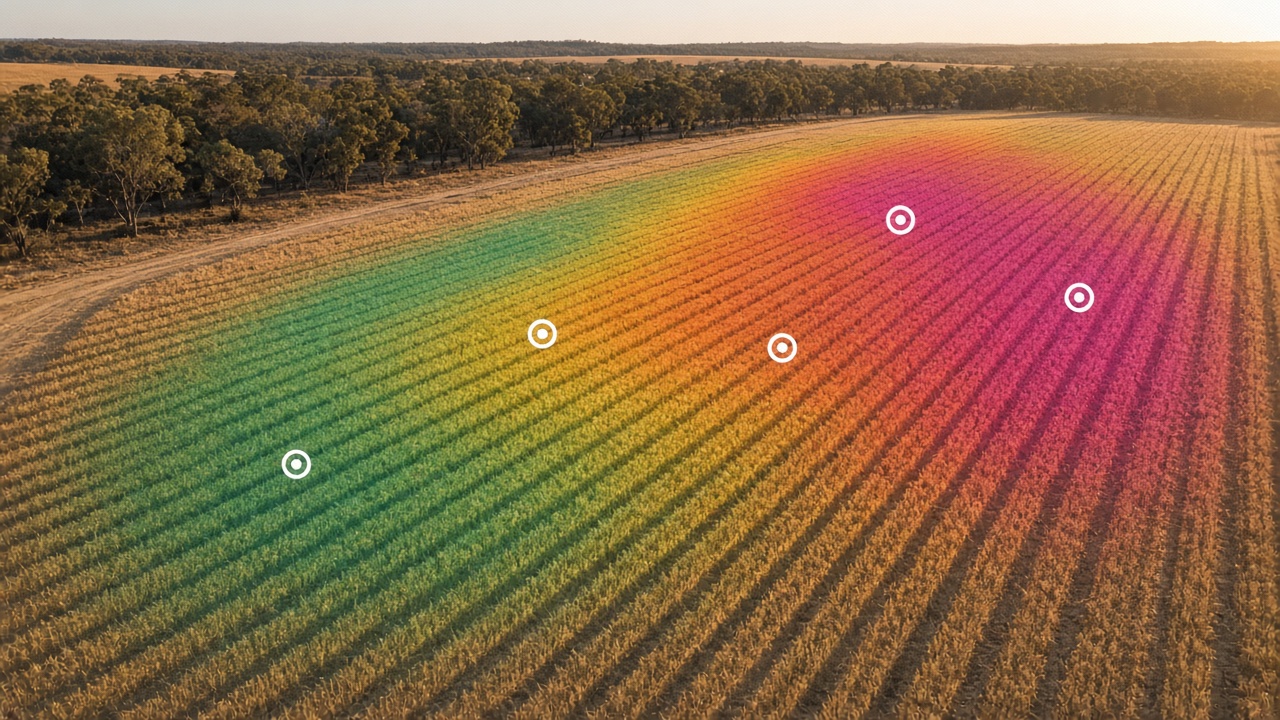
A paddock photo is more useful when it names the problem. Mapizy’s agriculture work uses imagery to detect weeds and crop disease, and to estimate soil carbon, so fertiliser and herbicide decisions start from a map rather than from a single walk.
The published agriculture solutions cover weed and crop-disease detection and soil-carbon estimation, alongside forest inventory and land-use change. Custom work already delivered includes skeleton weed in drone images, cotton disease in drone images, and hay quality in smartphone images. Snail and slug counts are a separate briefing.
Key takeaways
Skeleton weed
Drone images are used to detect skeleton weed so treatment can follow the plants, not the whole paddock.
Cotton
Cotton disease detection uses drone images of the crop.
Hay quality
Hay quality can be quantified from smartphone images.
Carbon
Soil-carbon estimation sits with the same agriculture analytics, next to fertiliser and herbicide planning.
Methodology
Match the camera to the question
Drone images for weed and cotton disease. A phone image for hay. The carbon estimate uses the agriculture imagery workflow.
Detect or estimate
Locate the weed or disease, or produce the carbon and hay-quality figures from those images.
Act on the map
Use the result to place herbicide, review disease, or plan carbon and feed, then confirm in the paddock.

Practical applications
Growers and advisers can separate a weed or disease job from a whole-paddock spray, and can keep a carbon and hay reading beside that map. See agriculture solutions and the briefing on pest monitoring.
Weed and crop-disease detection, soil-carbon estimation, skeleton weed, cotton disease, and hay quality are taken from Mapizy’s published agriculture and custom-solutions pages. This report does not assign detection rates or carbon tonnes. Lighting, growth stage, and image scale still affect the result. Diagrams are conceptual.
Related reports
AI-assisted pest monitoring for agriculture
Snail detection, density maps, and variable-rate baiting from field images.
Read report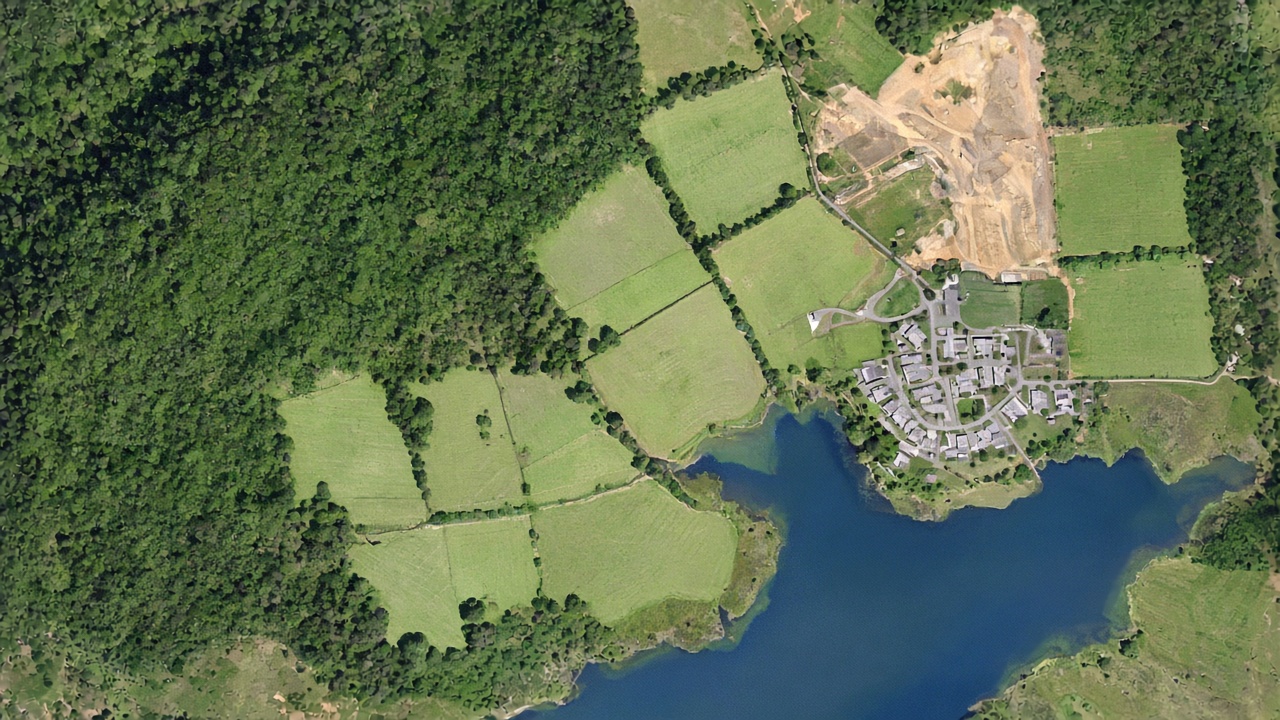
Monitoring forests and land cover at scale
Forest inventory plus GIS-ready layers for trees, turf, water, structures, and bare ground.
Read report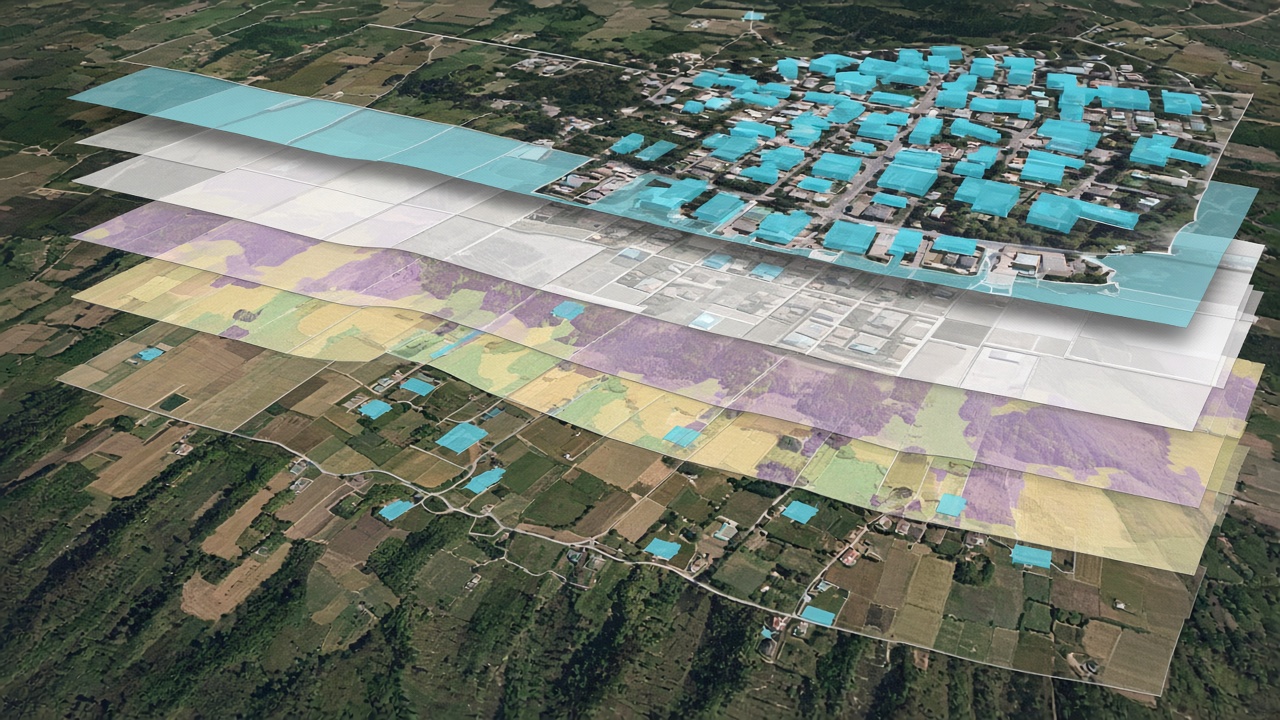
Property analytics in one batch
The Analytics Engine runs many properties together, then leaves the results open to inspect and export.
Read reportReview a paddock from imagery
Request a demo to discuss weed, disease, hay, or soil-carbon analytics on your own images.
Request a demo