
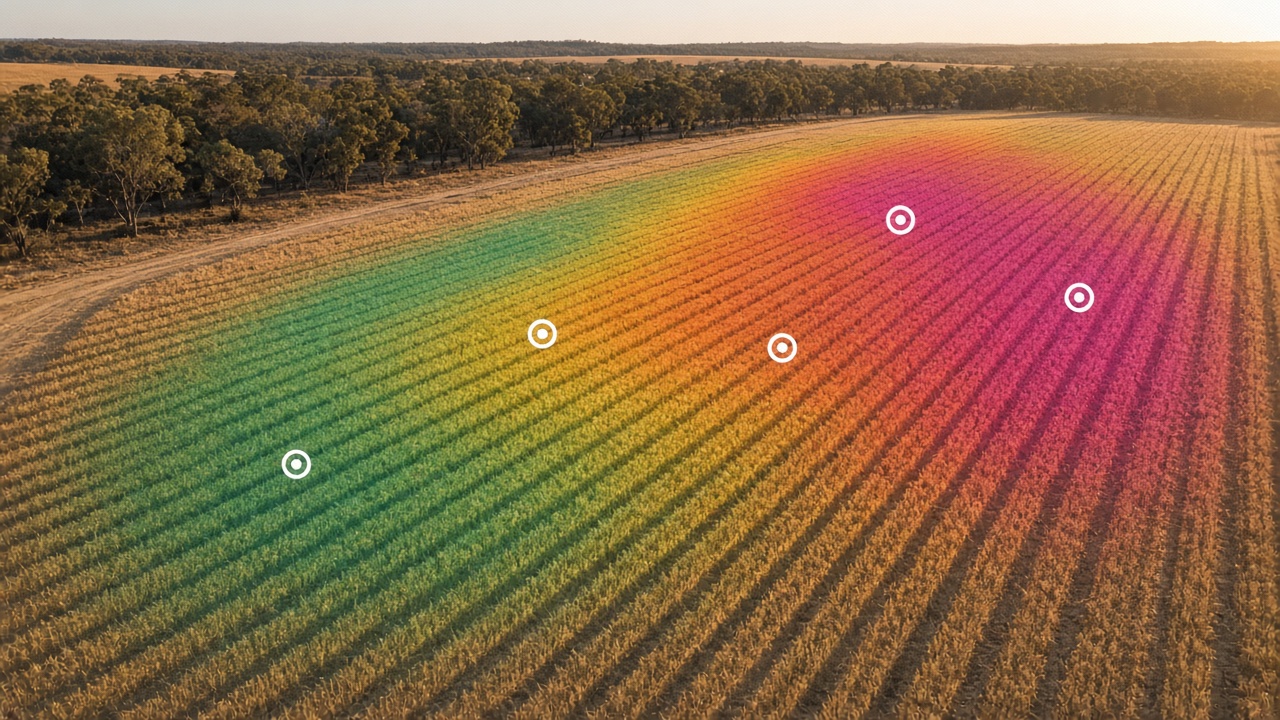
Snail pressure is not uniform across a paddock. A density map from field images can steer bait to where pests actually are, instead of treating the whole farm the same way.
Snails consume crops and contaminate grain. Mapizy’s published pest-control work identifies snails in smartphone images, then builds a density map across the farm. That map was used with variable-rate technology to set bait rates, with the stated aim of lowering pesticide cost and reducing overuse. Agriculture solutions on the site also cover weed and crop-disease detection.
Key takeaways
Field photos
The documented workflow starts with smartphone images rather than a full satellite campaign for every snail count.
Density map
Counts become a spatial layer so operators can see where pressure is high, not only that snails are present.
Variable rate
The density map is intended to set bait rates instead of a uniform chemical application.
Weeds and disease
The same agriculture brief lists weed and crop-disease detection as companion image-based tasks.
Methodology
Collect samples
Capture smartphone images across the farm so the model sees local snail presence rather than a single scouting stop.
Detect and map
Identify snails in those images and assemble a density surface for the paddock.
Adjust the rate
Feed the density map into variable-rate baiting so chemical use follows observed pressure.

Practical applications
Growers can use a mapped pest layer to plan baiting instead of treating every hectare the same. Related agriculture work on the site covers weeds, crop disease, soil carbon, and land-use change. See the pest-control use case and agriculture solutions.
Snail detection, density mapping, and variable-rate baiting are taken from Mapizy’s published use-case and solutions pages. This report does not assign pesticide-cost savings or model accuracy. Sample coverage and image quality still bound the map. Diagrams are conceptual.
Related reports
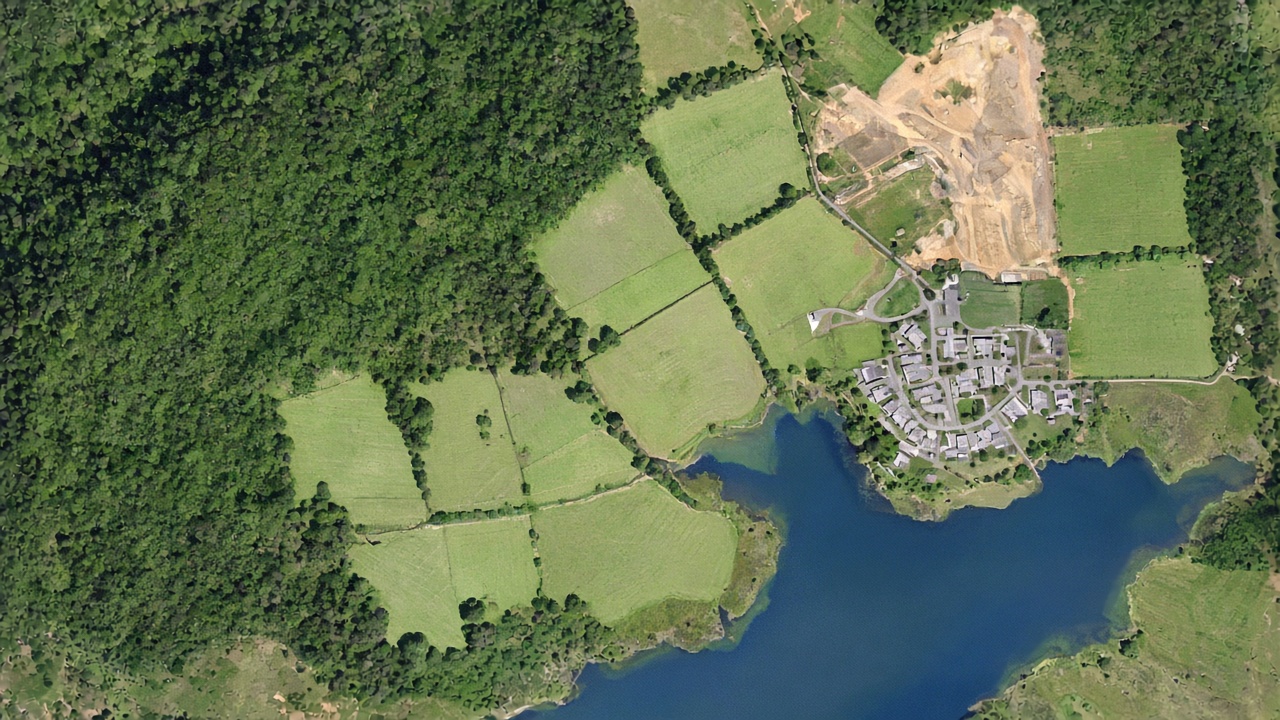
Monitoring forests and land cover at scale
Forest inventory plus GIS-ready layers for trees, turf, water, structures, and bare ground.
Read report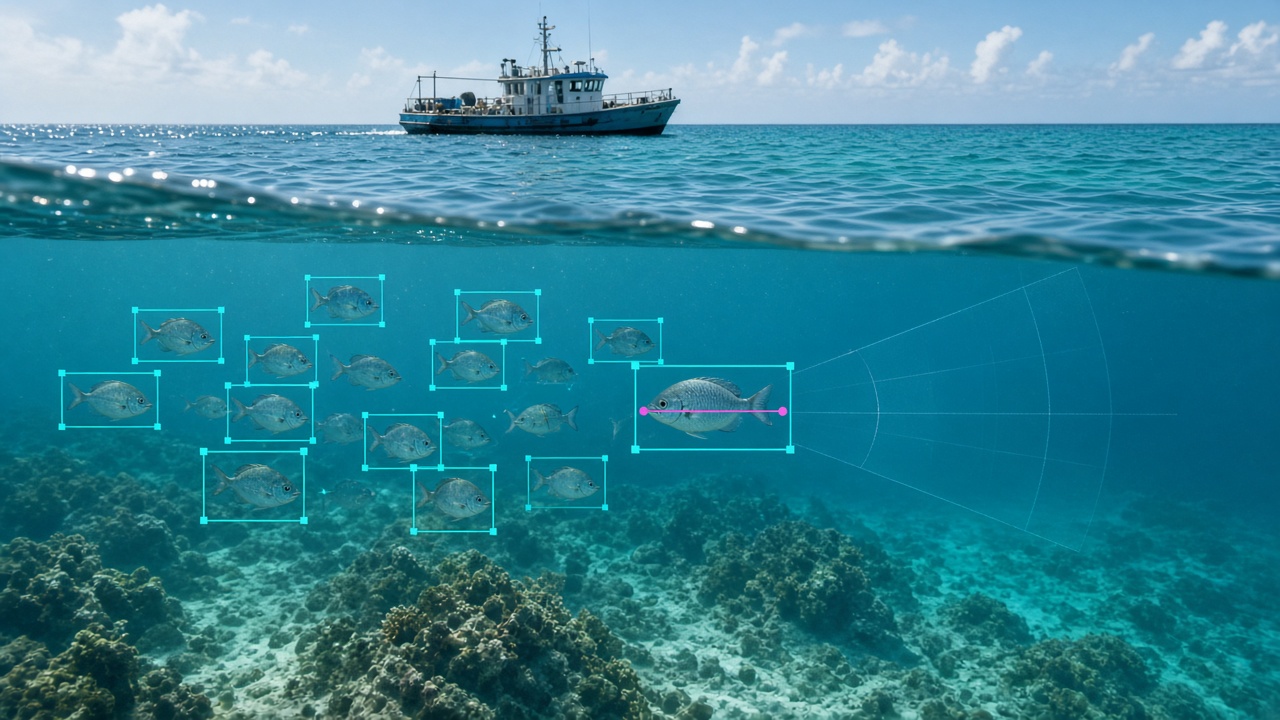
Computer vision for fish survey and biomass
Taxonomy, counts, length measurement, and biomass from underwater stereo video.
Read report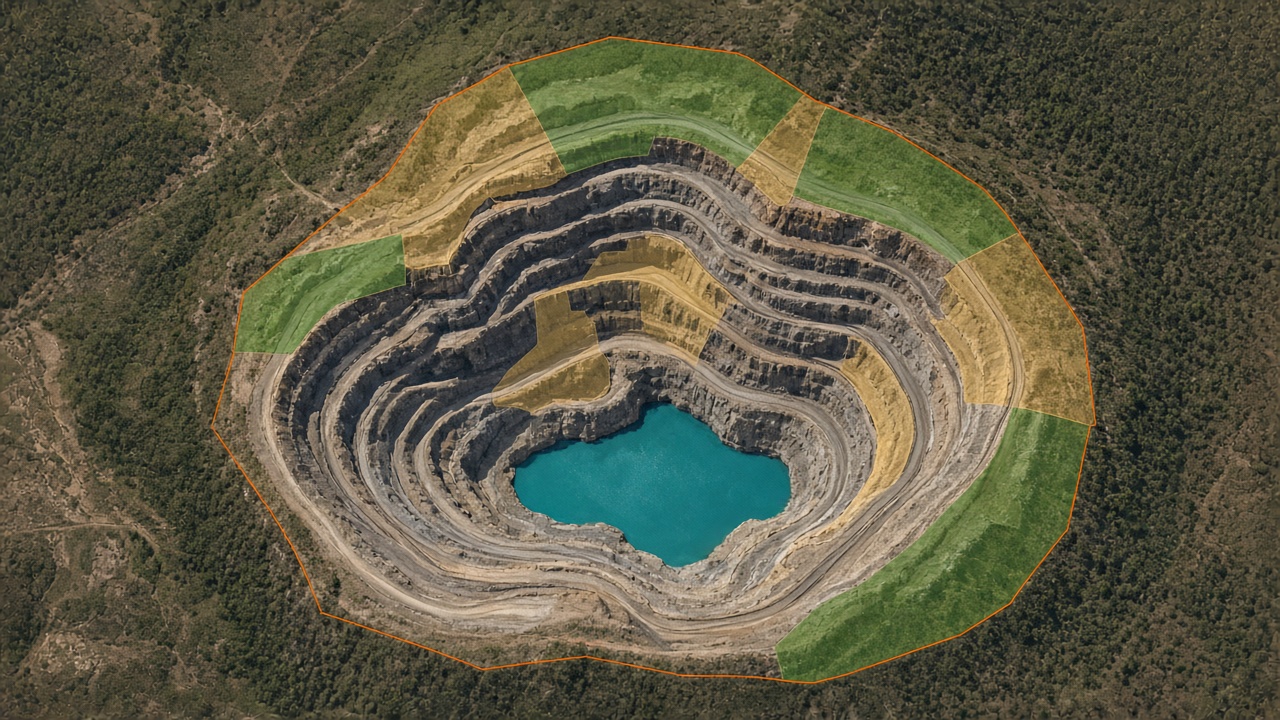
Mine rehabilitation monitoring with satellite imagery
Track rehab parameters and environmental change from high-resolution satellite scenes.
Read reportTalk through a pest-monitoring workflow
Request a demo to review how image-based pest maps can sit beside other agriculture analytics.
Request a demo