
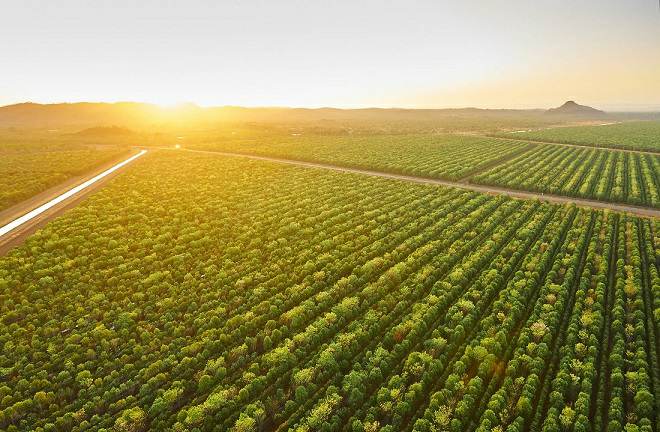
Forest inventory and land-cover layers let managers measure stocking, weeds, canopy, water, and bare ground from imagery instead of relying only on sparse field samples.
Direct forest inventory is labour-intensive and subject to sampling error. Mapizy has applied deep learning to Pleiades imagery for sandalwood inventory, measuring stocking, weed infestation, and gaps. The same family of models supports land-cover layers for trees, turf, water bodies, man-made structures, and bare ground, plus tree and turf coverage at property and suburb level on a quarterly update cycle.
Key takeaways
Inventory components
Stocking, weed infestation, and gaps between trees can be measured from imagery rather than only from plots.
Five land-cover classes
Packaged land cover includes trees, turf, water bodies, man-made structures, and bare ground, ready for GIS analysis.
Quarterly tree and turf
Government users can access tree and turf coverage derived from current aerial images at property and suburb level.
Rehab and carbon
The same remote-sensing approach is used for mine-rehabilitation assessment and soil-carbon / land-use monitoring in agriculture solutions.
Methodology
Choose the sensor
High-resolution satellite such as Pleiades for plantation inventory; current aerial imagery for urban tree and turf cover.
Classify cover
Map trees, turf, water, structures, and bare ground, then derive inventory metrics such as stocking and gaps.
Watch change
Compare epochs for deforestation, vegetation-cover change, and rehabilitation progress instead of waiting for the next field campaign.
Practical applications
Forestry companies can use inventory to plan operations without waiting on exhaustive ground counts. Councils can use tree and turf layers for green-space policy. Agriculture solutions on the site also cover weed and crop-disease detection. See Land Cover, Government, and the forest-inventory use case.
Layer names, quarterly urban tree/turf updates, and forest-inventory components are taken from Mapizy’s website. This report does not assign accuracy percentages. Seasonal phenology and cloud cover still affect classification. Diagrams are conceptual.
Related reports
Review land-cover layers
Request a demo to inspect GIS-ready land-cover and vegetation coverage on your area of interest.
Request a demo