
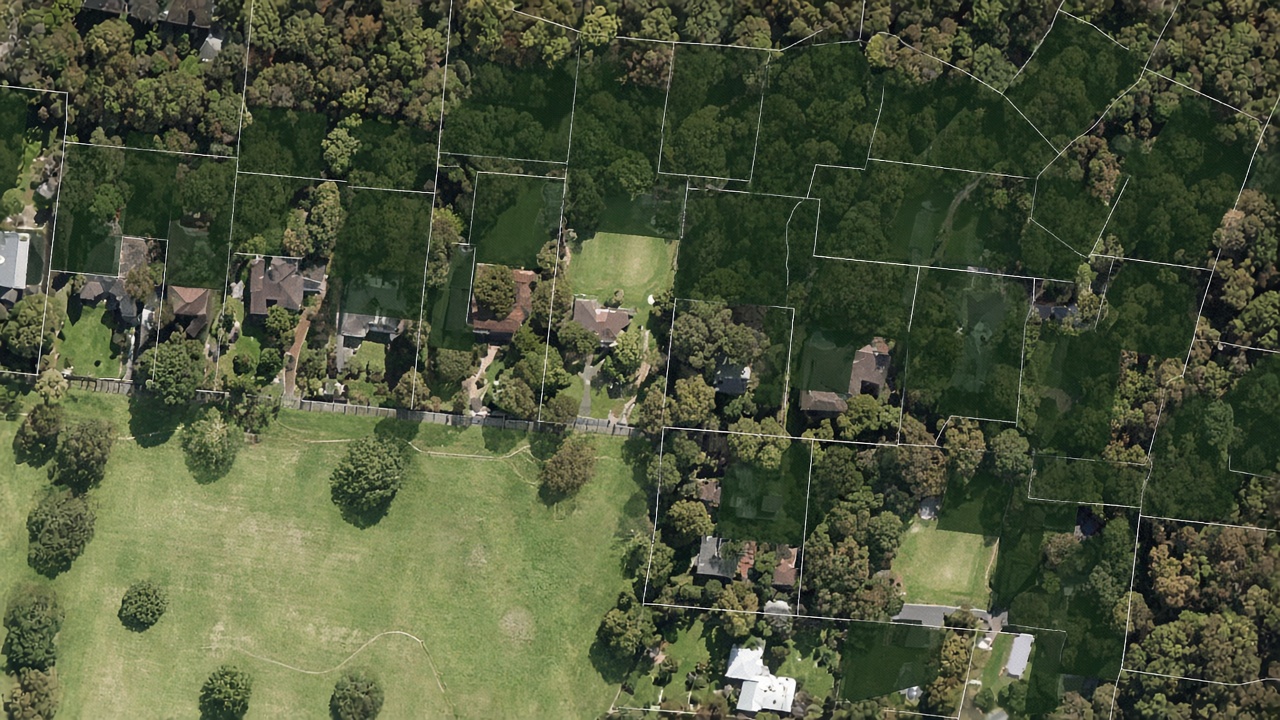
Green-space policy needs a current canopy number at the parcel and the suburb, not a once-a-decade map. Quarterly tree and turf layers from aerial imagery give councils that refresh cycle.
Mapizy’s government pages describe tree and turf coverage derived from the most up-to-date aerial images, available at property and suburb level on a quarterly update cycle, to support green-space policy. Packaged land cover includes trees and turf among five GIS-ready classes. Property analytics also record trees, turf, and tree overhang, so canopy is both a public-policy layer and a parcel risk attribute.
Key takeaways
Property and suburb
Tree and turf coverage is published at both parcel and suburb level, so a street and an LGA can be compared on the same cycle.
Quarterly updates
Government users are offered a quarterly refresh from current aerial imagery rather than a static canopy snapshot.
Trees and turf
Land-cover products separate trees from turf, water, structures, and bare ground so canopy is not mixed with lawn.
Overhang context
The same vegetation read supports insurance filters such as tree overhang and distance to bushland.
Methodology
Start from current aerials
Use the latest urban aerial imagery so canopy is tied to a known capture window.
Separate cover classes
Map trees and turf as distinct classes, then roll coverage up from property to suburb.
Refresh quarterly
Repeat the classification so green-space policy can track loss, gain, and seasonal cover instead of a one-off study.

Practical applications
Councils can use quarterly tree and turf layers for green-space policy and suburb comparisons. Insurers can use overhang and vegetation attributes on the same parcels. See Government, Land Cover, and forest and land-cover monitoring.
Quarterly tree and turf coverage, property-and-suburb reporting, and land-cover class names are taken from Mapizy’s government and packaged-data pages. This report does not invent canopy percentages or heat-island reductions. Seasonal leaf-on/leaf-off and image date still affect classification. Diagrams are conceptual.
Related reports
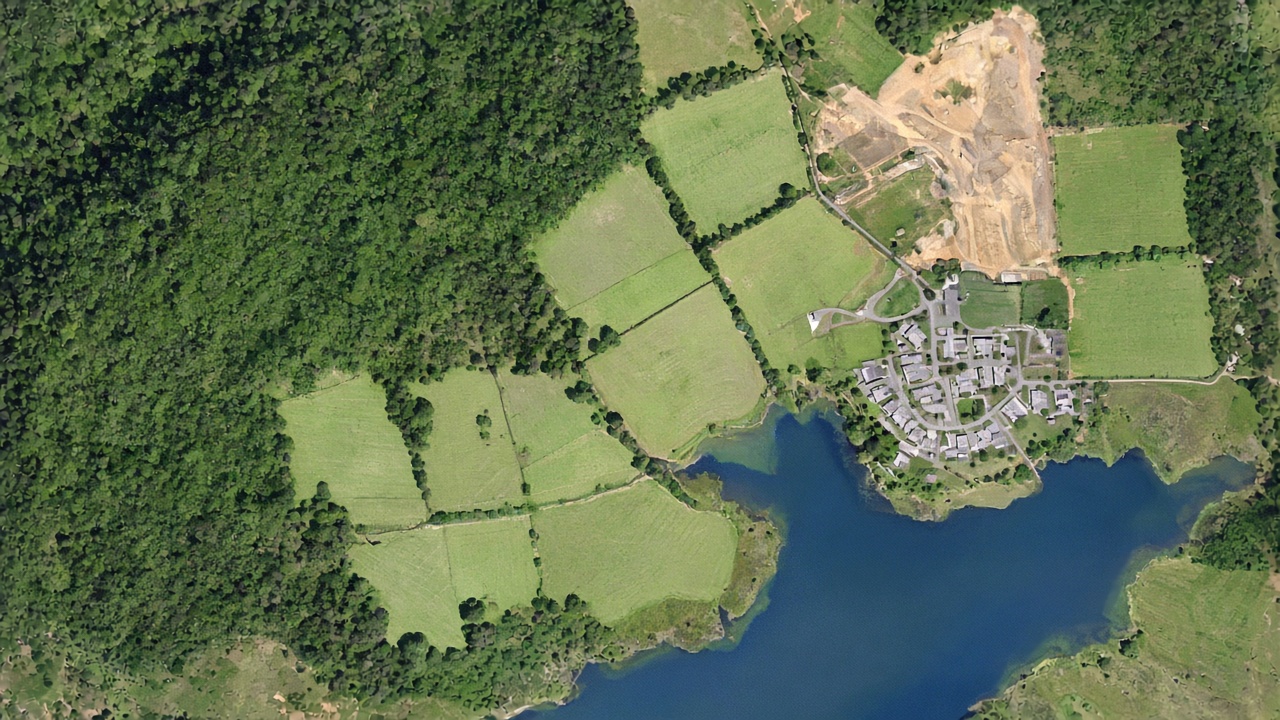
Monitoring forests and land cover at scale
Forest inventory plus GIS-ready layers for trees, turf, water, structures, and bare ground.
Read report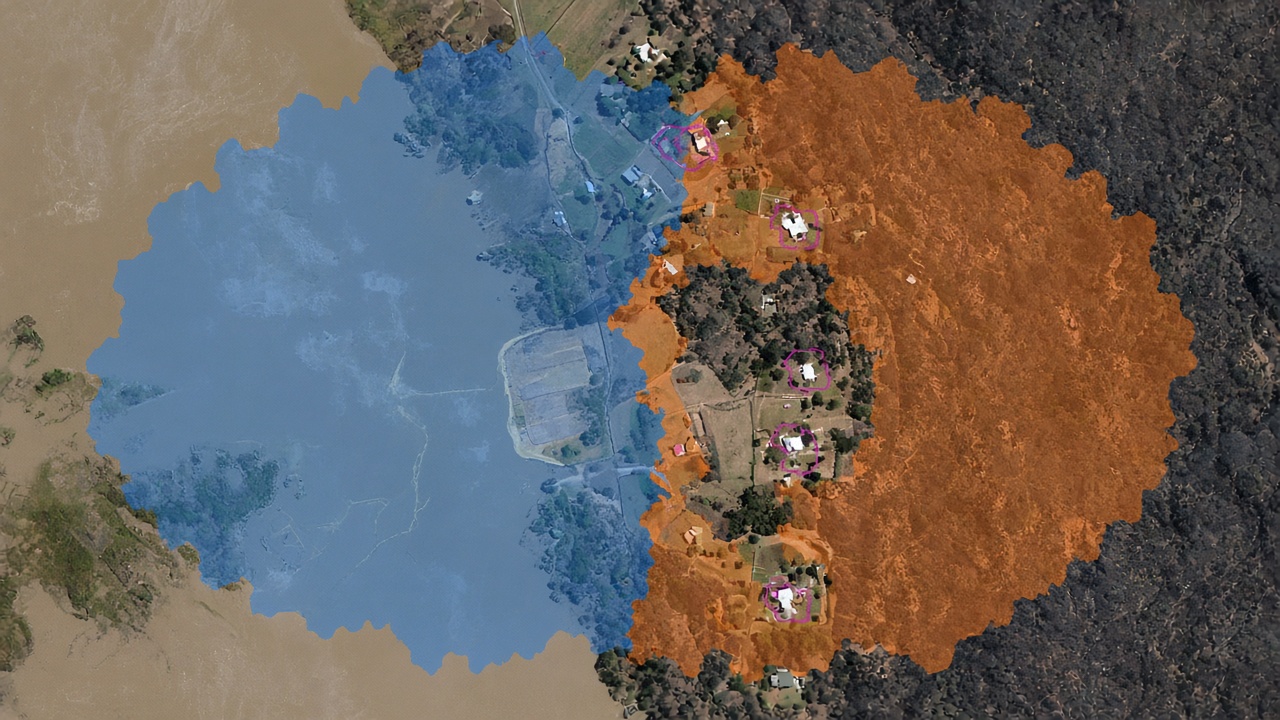
Geospatial intelligence for flood and bushfire response
Pre- and post-event analytics so claims and response teams can see what changed.
Read report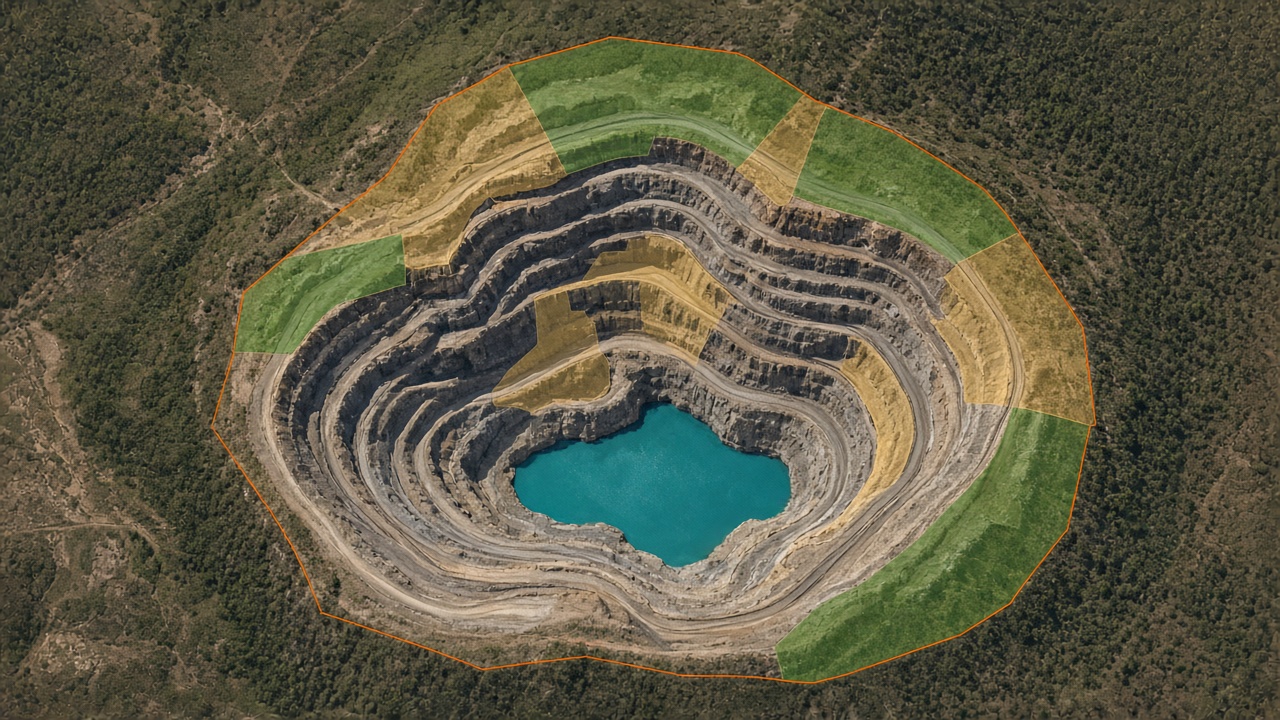
Mine rehabilitation monitoring with satellite imagery
Track rehab parameters and environmental change from high-resolution satellite scenes.
Read reportInspect tree and turf coverage
Request a demo to review quarterly canopy and turf layers at property and suburb level.
Request a demo