
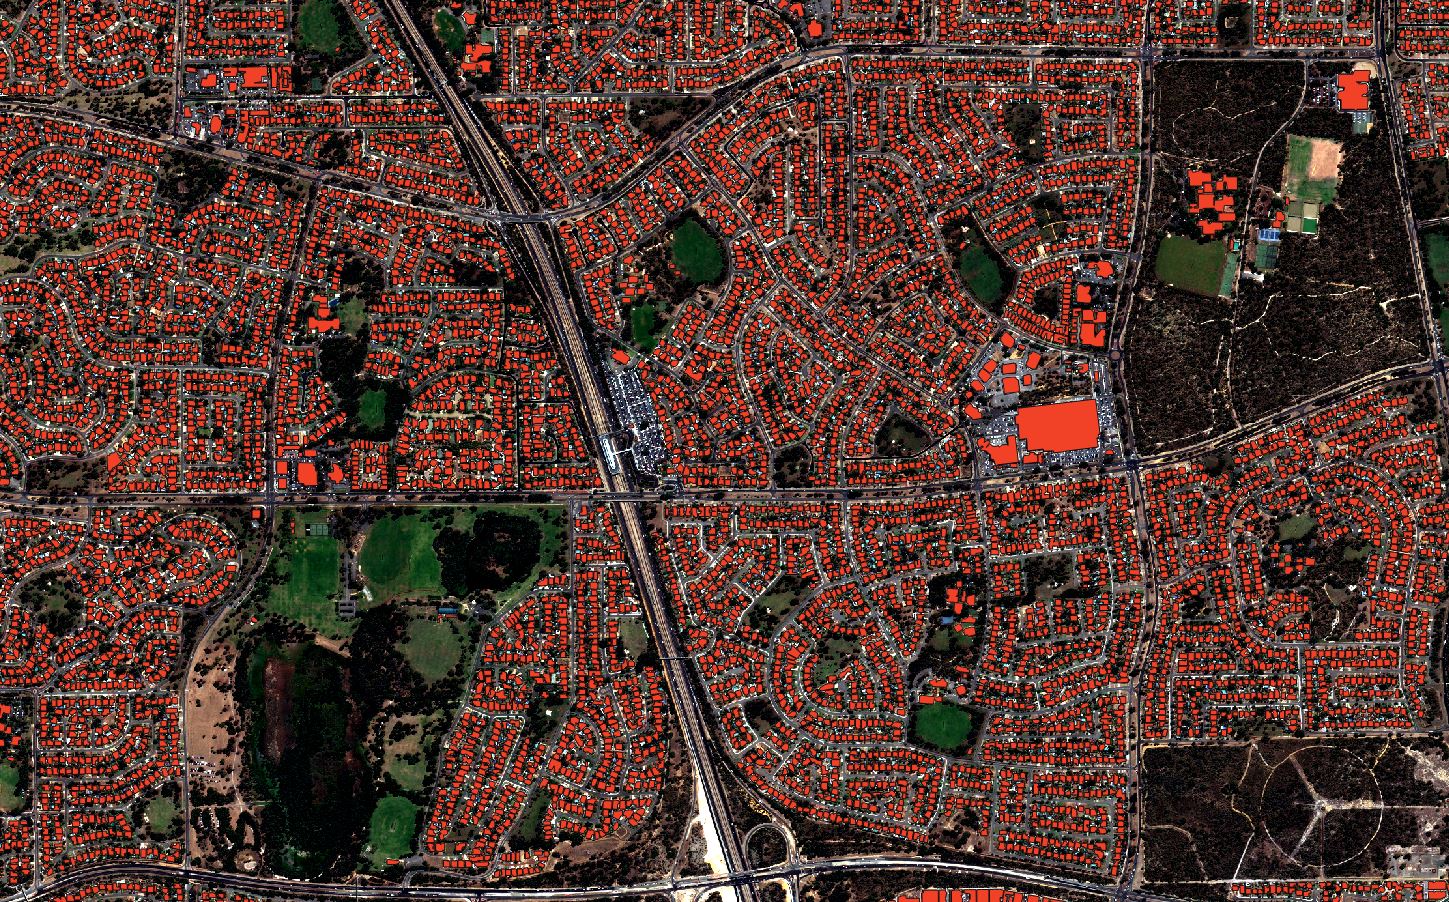
Geospatial data quality is not a single accuracy number. Buyers should ask about currency, coverage, resolution, update cadence, and whether change is measured, not only mapped once.
Mapizy describes its property and urban data as highly detailed and current, with surveying-grade accuracy, change insight in user-defined intervals, and comprehensive, frequent urban coverage in Australia. Those claims are a useful checklist even when you are comparing vendors: if a dataset cannot answer those questions, it is hard to operationalise.
Key takeaways
Ask the image date
Mapizy states a three-month currency for geospatial analytics and packaged footprints. A quality review should require the actual capture window, not only a marketing label.
Urban and remote
5 cm aerial imagery is described for 80% of the Australian urban environment, with high-resolution satellite for remote properties. Coverage maps matter as much as sample screenshots.
Attribute depth
Inspection-quality property analytics, 30-plus attributes, and GIS-ready land-cover or road layers only help if they match the decision you need to make.
Delivery path
Web app, batch tools, API, and automated reporting are part of quality: a precise layer that cannot enter a workflow is unused.
A four-question review
How current is it?
Confirm last image date, refresh cycle, and whether change is computed over a user-defined interval. Mapizy’s urban analytics describe 3–6 month change windows for portfolio questions.
How complete is it?
Ask where aerial versus satellite is used, and whether remote areas are in or out. Completeness is a coverage story, not a single national percentage on a slide.
Is it fit for the task?
Roof quality for quoting is a different product from forest stocking or road furniture. Match the layer to the workflow: insurance, government, agriculture, or infrastructure.
Can teams use it?
Look for API, export formats, and notification. Mapizy also describes user feedback for continuous AI improvement, which is part of an operational quality loop.
How this maps to Mapizy products
Property and urban platforms, packaged footprints, roads, and land cover, plus Studio reporting, are the concrete surfaces where these questions get answered. Read them alongside the earlier reports on property risk, roads, and land cover, and the platform feature list.
Currency, 5 cm urban coverage, surveying-grade accuracy, and delivery features are quoted from Mapizy’s public site. This framework does not publish an independent accuracy audit. Always validate a sample AOI before procurement. Diagrams are conceptual.
Validate quality on your own AOI
Request a demo and bring the four questions above to a live sample.
Request a demo