
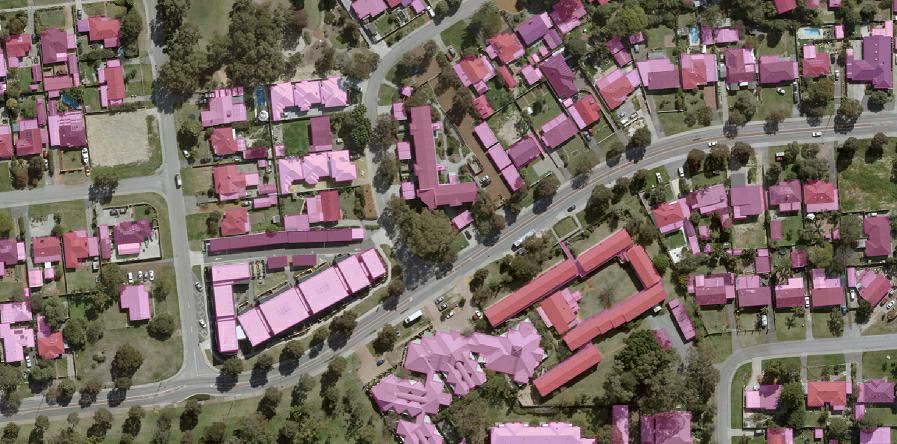
An accurate building footprint is only useful if it is current. Change maps tell teams what was added, removed, or altered between image dates.
Real-estate, insurance, and government users need up-to-date building footprints and change maps. Mapizy uses high-resolution aerial and satellite imagery to create building-footprint data with a stated three-month currency, then applies deep learning to detect footprint change for compliance, valuation, and disaster assessment.
Key takeaways
Building footprint
GIS-ready footprints derived from aerial and satellite imagery, described as globally available packaged data.
Three months
Packaged footprint data is positioned as the most up-to-date available when needed, with a three-month update cycle.
Change maps
Deep-learning change detection supports adverse-possession checks, approved-plan compliance, and disaster damage review.
Parcel to suburb
Urban Analytics tracks urban growth, vegetation cover, and property counts so local change sits in a wider context.
Methodology
Map the built form
Extract building outlines from the latest high-resolution imagery rather than relying only on older cadastre or mapping layers.
Compare dates
Run change detection between image epochs so new, removed, or expanded buildings become a map, not a guess.
Roll up
Use suburb and LGA analytics for growth rate, inventory, and notification of property changes that affect rates or policy.
Where change maps are used
Real estate and compliance
Updated footprints help check potential adverse-possession claims and whether built form still matches approved plans. History of property change also feeds more grounded valuation.
Insurance and government
Insurers need change maps after bushfire and flood. Councils can update geospatial databases more frequently and get notified of property changes that affect rates and compliance. See Government and Building Footprint.
Statements about currency, coverage, and change detection come from Mapizy’s packaged-data, use-case, and industry pages. No customer hit-rate or accuracy percentage is claimed here. Image alignment, occlusion, and date gaps remain real constraints. Diagrams are conceptual.
Related reports
Review footprint and change data
Request a demo to inspect building footprints and urban change on your area of interest.
Request a demo